At first glance, working with reports in SAP Fieldglass seems simple and intuitive. Thanks to the user-friendly interface and the drag-and-drop method, creating a report feels like a breeze—just select the fields, organize them how you like, and voilà! You’ve got yourself a report.
Because of this, training users on this module is usually smooth—in just a few minutes, they leave feeling confident, generating multiple reports.
However… when it comes to reporting timesheet data, things take a different turn. Users often return asking for help or, worse, claiming that the system is incorrect.
So, stick with me, and try to let’s clear up this confusion together!
Basic Concepts
Before diving into reports, fields, and how to use them effectively, let’s start with some key concepts. Understanding these will help make everything much clearer and easier.
Rate Categories
When setting up rates, you must define a category. This serves as a way to group rates and track hours/days submitted under those rates. In simple terms, the rate category determines how much a worker will be paid both within and outside of standard working hours.
You’ll often see rate categories in the accounting section of job postings, where you need to confirm the amounts associated with each category for a specific job.
For each category, you must assign a Rate Type, which determines the classification of that rate.
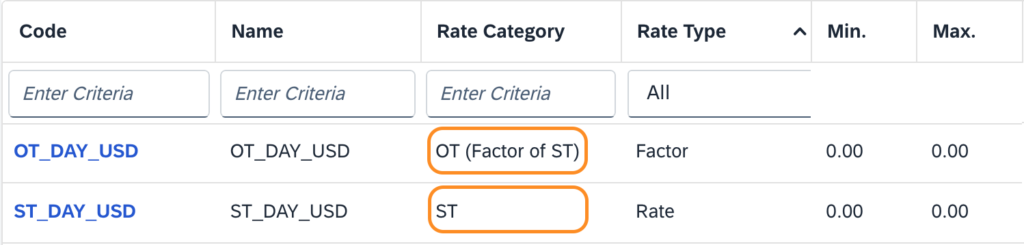
For example, let’s say we have two rates:
- ST_DAY_USD (Standard Time)
- OT_DAY_USD (Overtime)
Each belongs to a different Rate Category: ST (Standard Time) and OT (Overtime).
Rate Types
Every category must be assigned to a Rate Type, which specifies the kind of rate within that category. SAP Fieldglass uses four standard types:
- ST (Standard Time)
- OT (Overtime)
- DT (Double Time)
- Others


Now that we’ve established the connection between rate categories and rate types, this will be crucial to understanding timesheets and reports.
Timesheet Data Structure
When looking at timesheets, things cannot make sense. Some column names suggest one thing but actually represent something completely different. Honestly, this part of the system could use a redesign.
To make things clearer, let’s break down some columns that frequently cause confusion.
Rates Column:
Despite the name, this column does not display individual rates. Instead, it combines:
- Rate Type (e.g., ST or OT)
- Unit of Measure (UOM) (e.g., Day or Hour)
So, if your rates are measured in days, this column will show a combination of Rate Type + Day (ST / DAY).
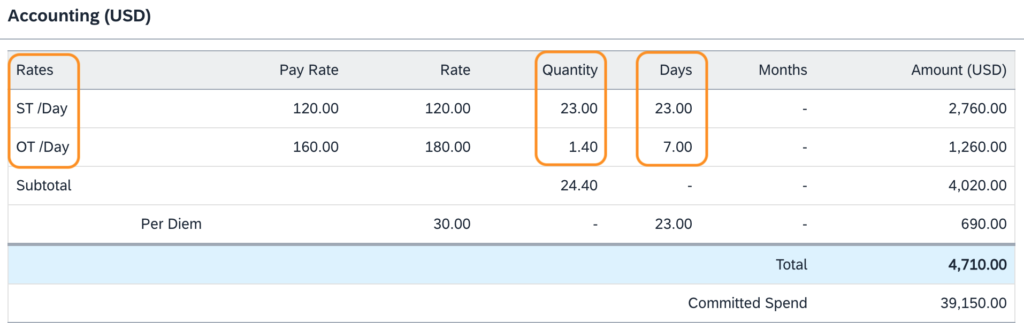
Quantity Column:
This column totals all hours or days submitted for a rate type.
For example, if you have overtime rates at 25% and 50%, this column will show the total quantity of overtime hours or days worked, regardless of the specific overtime percentage.
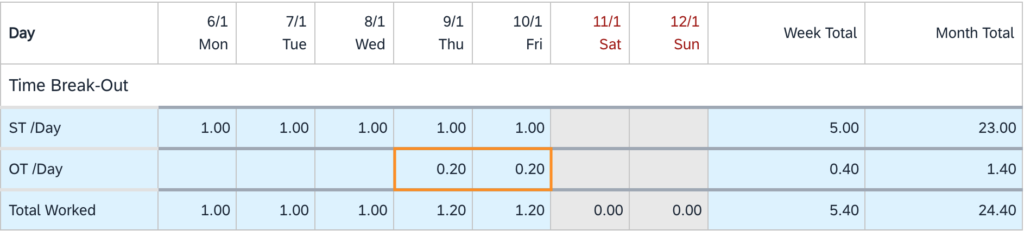
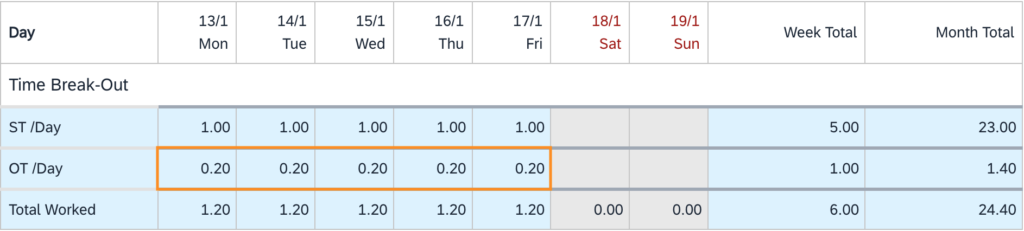
Days Column:
This one trips up a lot of people. You might expect it to show the total number of days worked, but it actually shows how many distinct days in the month contain entries for each rate type.
For example, for the Overtime (OT), we have 1.4 days recorded in the Quantity Column, where those 1.4 days were logged across 7 different days, each with 0.2 days of overtime, then we have 7 days in the Days Column.
Understanding The Report Fields
Since our goal is to report the number of hours or days worked, I’ll guide you through the key fields you need to understand, explaining how the main report fields function.

Billable Days:
This field returns the total number of days with any recorded work activity.
For example, in our case, we have 23 billable days, meaning that work was recorded on 23 different days in the month.

Billable Hours (By Rate Type):
Here’s where things start to get tricky.
The name suggests that this field reports worked hours, but in reality, it reports values submitted under the rate type—whether the rate is hourly or daily, the values appear here, consolidated by rate type.
For example, if our scenario included:
- 1.4 days of 50% overtime
- 2 additional days of 100% overtime
The Billable Hours (OT) field would show 3.4 days.

Timesheet Billable Hours:
This field follows the same logic as the previous ones but combines all rate types into a single total.
In our example:
- 23 days of Standard Time (ST)
- 1.4 days of Overtime (OT)
Total: 24.4 billable hours.

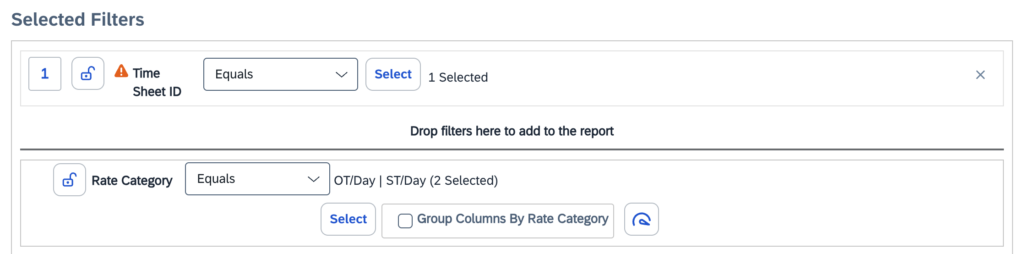
Timesheet Billable Hours (By Category):
This field is similar to Billable Hours, but instead of showing a single total, it separates the values by rate category.
If there is only one rate per category, the values will match those from the Billable Hours field.

When adding this field to a report, the system automatically applies a “Rate Category” filter, requiring you to select the categories you want to report on.
If multiple rates exist for the same category, this field consolidates the values accordingly.
Time Sheet Billable Days (By Category):
Now, things get a little weird…
You might expect this field to behave just like Time Sheet Billable Hours, but there’s a catch. While it does report billable days based on selected rate categories, it proportionally distributes the working days rather than simply counting them.

This means that:
- The system proportionally redistributes the ST and OT days based on the 24.4 total.
- The total number of “days” logged is 24.4 (23 ST + 1.4 OT).
- The total number of distinct billable days is 23.
Proportional Calculation Breakdown
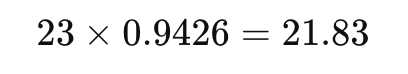
For Standard Rate (ST):
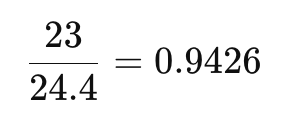
Applying this proportion to the 23 distinct working days:
For Overtime Rate (OT):
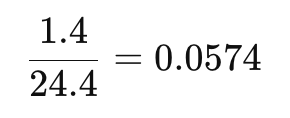
Applying this proportion to the 23 distinct working days:
So, instead of directly summing ST and OT days, the system adjusts the values proportionally to ensure that the total remains accurate to the actual number of distinct billable days.
Conclusion
I’ve spent a lot of time analyzing these fields, and honestly? I still don’t have all the answers. I understand how they work, but the logic behind them feels far from intuitive.
At the very least, now we know how the system structures and processes this data—even if we don’t fully agree with its logic! Despite all this complexity, it is possible to extract all timesheet data accurately.
I’m wrapping up this article feeling like I’ve not only tried to help—but also sent out a call for help! So, if you have insights or answers, I’d love to hear from you!